| |
|
|
Chicken Statistics

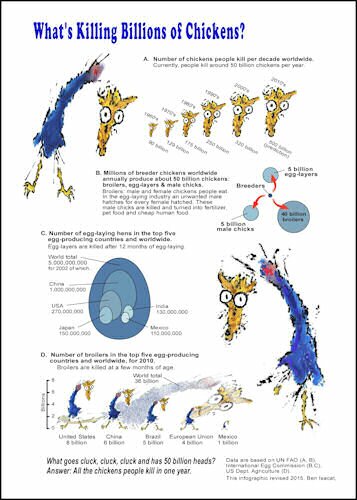
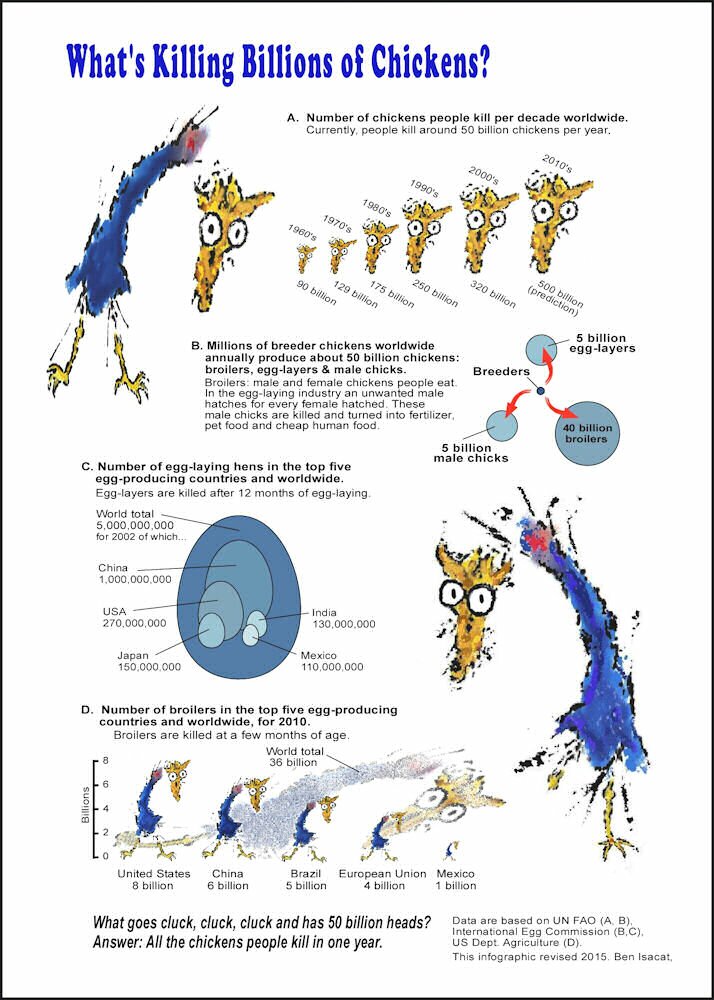
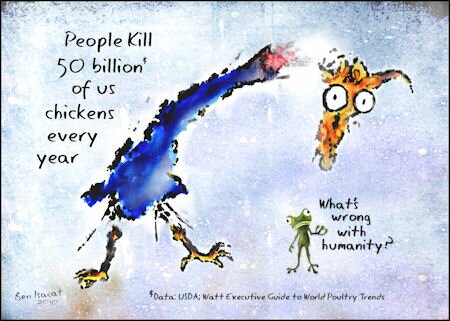
Click to enlarge. What goes cluck, cluck, cluck and has 50 billion heads?
More free illustrations.
|
 Types of Chicken
Almost all chickens in the world are factory farmed. The four categories of factory farmed chicken are:
- Broiler
- Male and female chickens packed into huge sheds and slaughtered after a few weeks to eat.
- Egg-layer
- Hens crammed into cages and each hen made to lay up to 300 eggs in a year. After one year they are worn out and slaughtered.
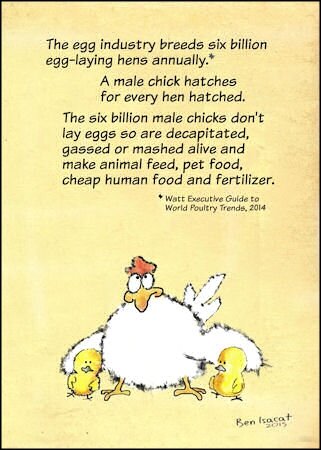
- Male chicks in the egg-laying industry
- A male chick hatches for every female chick. They are not wanted because they do not lay eggs so killed soon after hatching and sold as fertiliser and pet food.
- Breeder
-
Breeders are mainly females and breed more broilers and egg-layers. They are slaughtered after about a year.
Chicken Numbers Worldwide
The table shows that there are over 50 billion chickens worldwide: broilers, egg-layers, male chicks and breeders. All the chickens are killed within or after about a year.
Table 1. Breakdown of Chicken Numbers Worldwide
|
| Broilers |
40 billion (see Table 2) |
| Egg-layers |
Over 6 billion (see Table 3) |
| Male chicks in the egg-laying industry |
Over 6 billion |
| Breeders |
Several millions
(60 million in the US alone) |
| World Total |
Over 50 billion |
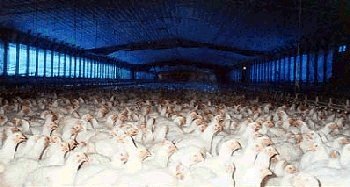
Broilers live packed together in massive sheds. Photo from Farm Sanctuary. |
Numbers of Broilers Produced Annually
About 40 billion broilers are alive in any one year. Just three countries produce over half of them: US, China and Brazil. Worldwide the number of broilers is increasing by about a billion per year.
Table 2. Numbers of Broilers Produced Annually.
Top ten countries & Worldwide for years 2008 to 2012.
Figures are in billions. |
| |
2008 |
2009 |
2010 |
2011 |
2012 |
| United States |
8.3 |
8.0 |
8.3 |
8.4 |
8.3 |
| China |
5.9 |
6.1 |
6.3 |
6.6 |
6.9 |
| Brazil |
5.5 |
5.5 |
6.2 |
6.5 |
6.8 |
| European Union - 27 states |
4.3 |
4.4 |
4.6 |
4.8 |
4.8 |
| Mexico |
1.5 |
1.4 |
1.4 |
1.5 |
1.5 |
| India |
1.3 |
1.3 |
1.4 |
1.4 |
1.4 |
| Russia |
0.8 |
1.0 |
1.2 |
1.3 |
1.4 |
| Argentina |
0.7 |
0.8 |
0.8 |
0.9 |
0.9 |
| Iran |
0.7 |
0.8 |
0.8 |
0.8 |
0.8 |
| Turkey |
0.6 |
0.6 |
0.7 |
0.8 |
0.8 |
| Others |
7.2 |
7.4 |
7.6 |
7.8 |
7.9 |
| World Total |
36.8 |
37.2 |
39.2 |
40.5 |
41.5 |
See Notes for Table 2, below.
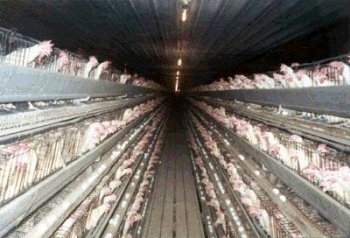
Egg-laying hens live crammed into cages. Photo from Farm Sanctuary. |
Numbers of Egg-laying Hens and Eggs
The figures in this table are an example of the worldwide numbers of egg-laying hens and the number of eggs they produce, in this case for the year 2011. For this year, there were about 6.4 billion egg-laying hens producing one trillion three hundred billion eggs. China is the biggest producer (2.5 billion hens and 1.3 trillion eggs), the US is the second largest producer (340 million hens and 90 billion eggs).
Table 3. Numbers of Egg-laying Hens & Eggs.
The top ten egg production countries & worldwide for 2011. |
| Countries |
Number of Hens |
Number of Eggs Produced |
| China |
2,500,000,000 |
474,000,000,000 |
| United States |
340,000,000 |
90,000,000,000 |
| Brazil |
280,000,000 |
38,000,000,000 |
| India |
240,000,000 |
58,000,000,000 |
| Indonesia |
240,000,000 |
24,000,000,000 |
| Mexico |
190,000,000 |
47,000,000,000 |
| Japan |
140,000,000 |
42,000,000,000 |
| Russia |
140,000,000 |
39,000,000,000 |
| Ukraine |
110,000,000 |
16,000,000,000 |
| France |
50,000,000 |
15,000,000,000 |
| World Total |
6,400,000,000 |
1,300,000,000,000 |
See Notes for Table 3, below.
Notes for the Tables
A precise count of the number of chickens and their eggs worldwide is impossible and therefore figures in all these tables are rounded to avoid spurious accuracy and totals do not necessarily add up.
Notes for Table 2
The source for the figures in Table 2 is Livestock and Poultry: World Markets and Trade. United States Department of Agriculture (web site accessed July 2012). USDA state that their data are based on �USDA-FAS attache reports, official statistics, and results of office research.� Figures for 2012 are their projections. Figures are in billions; thus, the total number of broilers produced for 2011 was about 40 billion.
The USDA data were in tonnes of ready to cook chickens (that is minus heads, feet and internal organs). The live slaughter weight of US broilers, according to USDA information, averages around 2.5 kg (5.5 lbs). Therefore, for these tables the assumption is that each ready to cook chicken weighs about 2 kg (4.4 lbs) and gives a conservative estimate of broiler numbers worldwide.
Given the imprecise nature of counting chickens, their weight and that the USDA data for this table included only the countries which are the major animal producers, the World Total in this Table 2 is a minimum figure.
Notes for Table 3
These figures are based on The Statistical Reference for Poultry Executives, by Watt Executive Guide to World Poultry Trends, 2011 (www.WATTAgNet.net).

›› To Entries & Home
|
|
Free Illustrations
|
|