| |


|
|
Summary
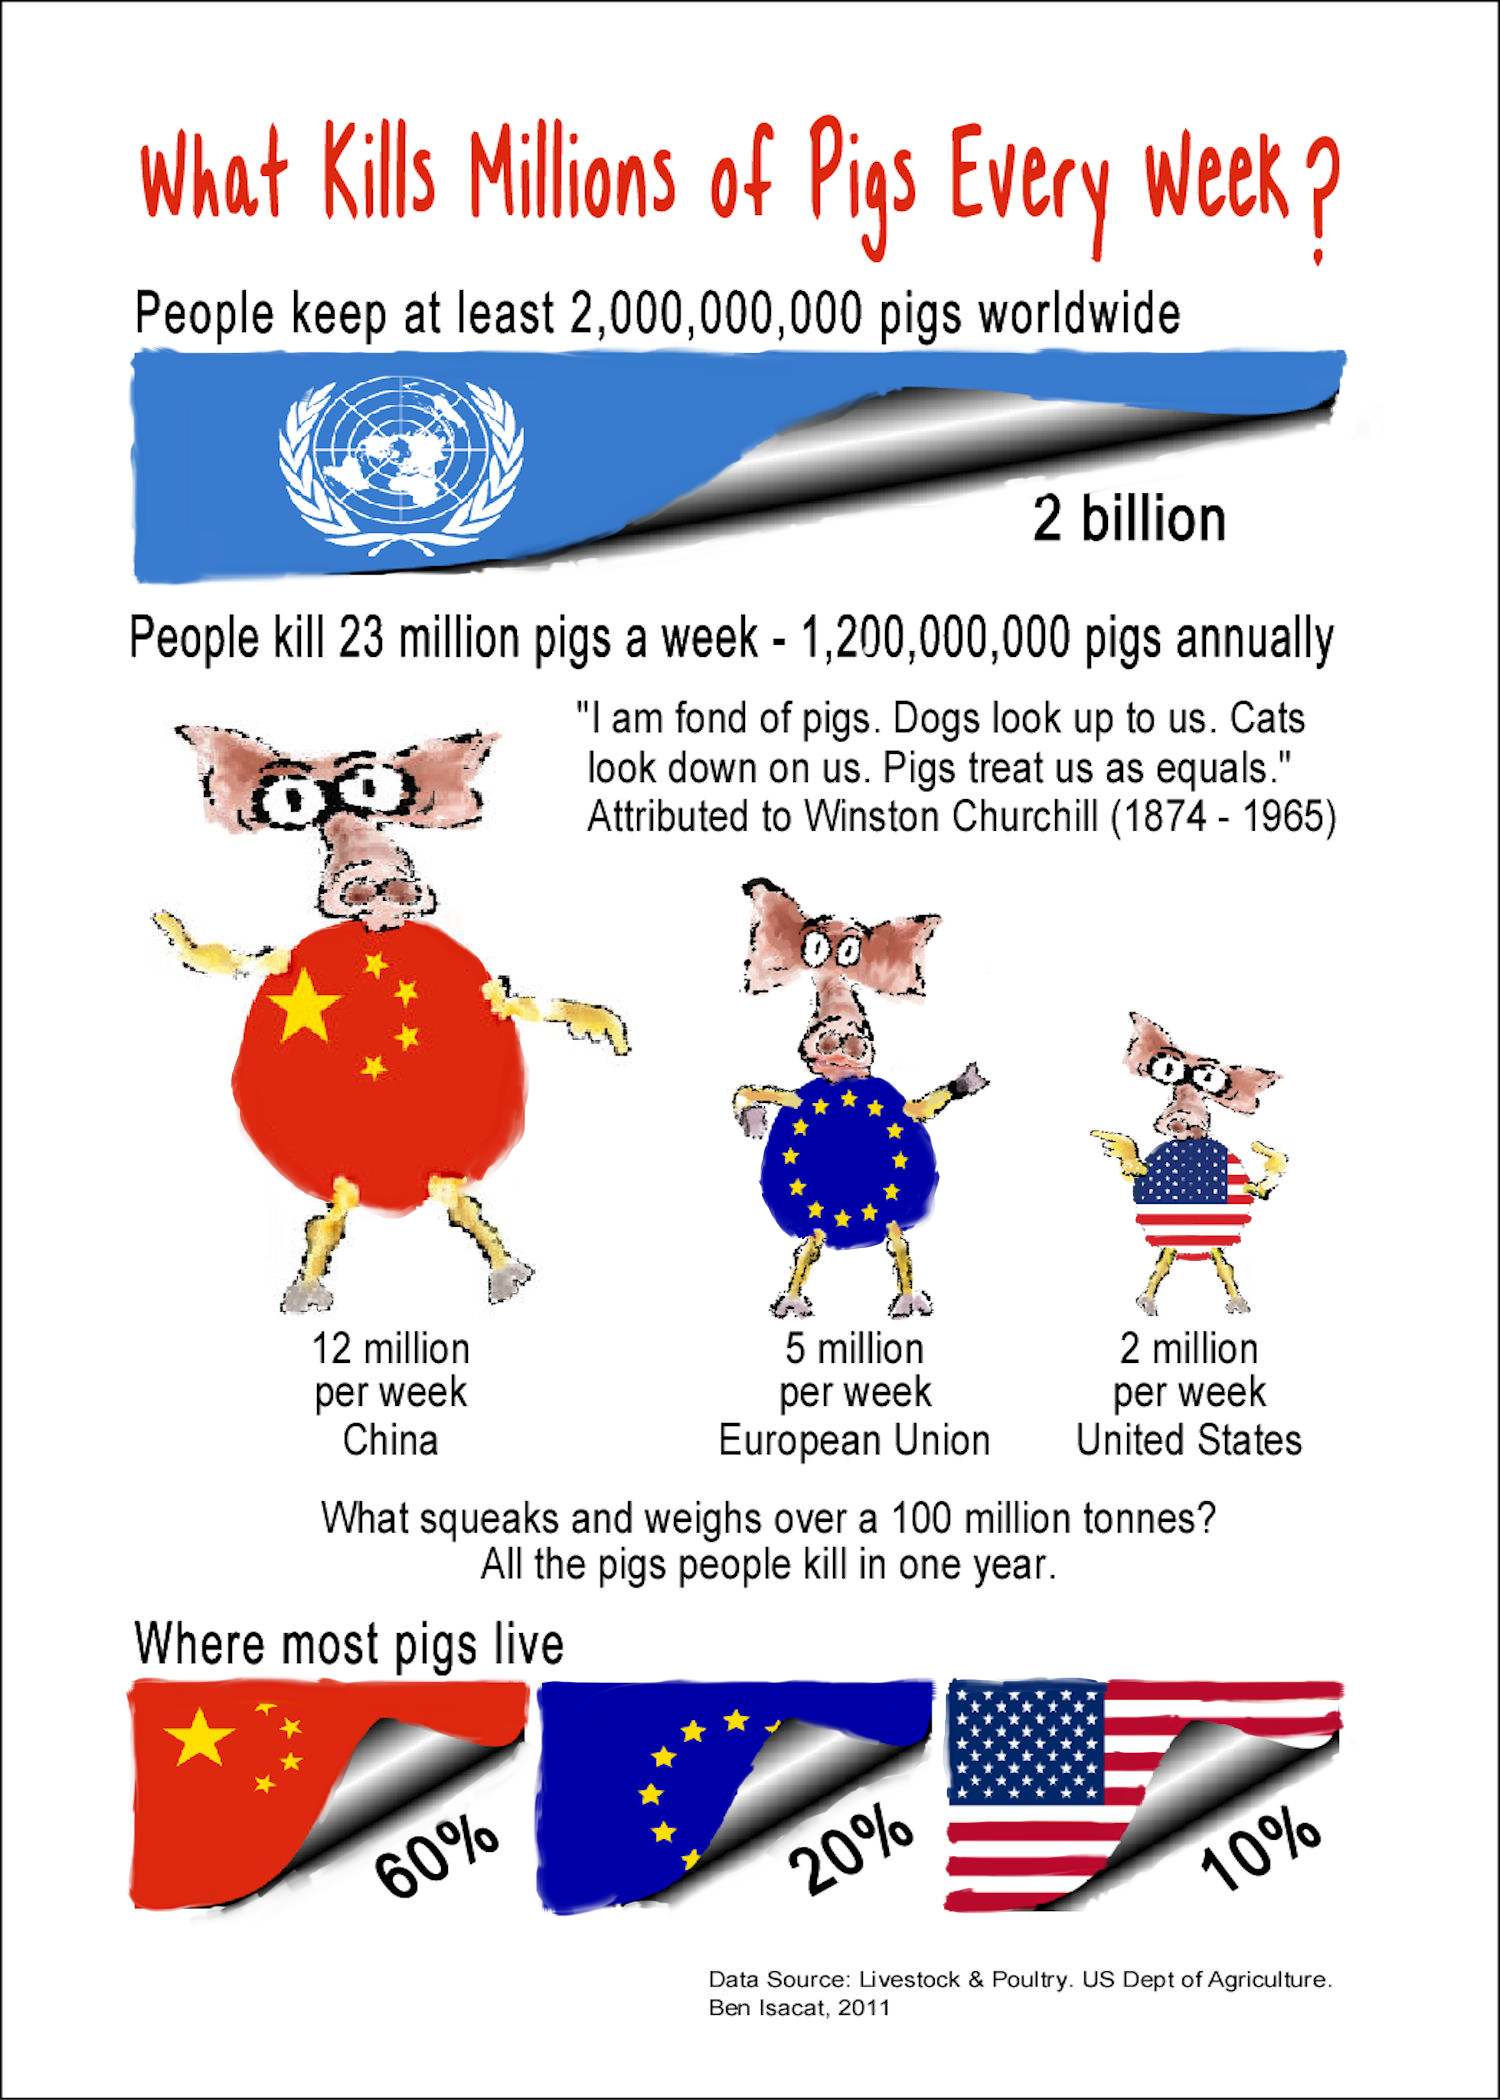
- People keep at least 2,000,000,000 pigs worldwide (Table 1).
- At least half the world's pigs live in China and 85 percent of pigs live in three countries: China, European Union and United States (Table 1).
- People kill about 1,200,000,000 pigs annually worldwide, an average of 23 million pigs a week (Table 2).
- About 85 per cent of the world's pigs die in three countries: China (12 million per week), European Union (five million per week) and United States (two million per week) (Table 2).
- The Chinese kill most pigs, about 50 percent of pigs slaughtered worldwide (Table 2).
The Number of Pigs People Keep Worldwide
Table 1. Total Number of Pigs People Keep Worldwide.
Top ten countries & Worldwide for years 2003 to 2008.
Figures are in millions.
|
| |
2003 |
2004 |
2005 |
2006 |
2007 |
2008 |
| China |
1,061 |
1,103 |
1,167 |
1,183 |
1,124 |
1,119 |
| European Union - 27 |
422 |
415 |
414 |
416 |
420 |
419 |
| United States |
161 |
163 |
165 |
167 |
171 |
174 |
| Brazil |
62 |
62 |
65 |
66 |
69 |
70 |
| Russian Federation |
52 |
52 |
52 |
54 |
56 |
60 |
| Canada |
46 |
48 |
48 |
48 |
47 |
46 |
| Mexico |
26 |
26 |
26 |
26 |
26 |
26 |
| Japan |
27 |
27 |
27 |
27 |
27 |
27 |
| Korea Republic |
24 |
23 |
22 |
22 |
23 |
23 |
| Ukraine |
16 |
14 |
13 |
15 |
16 |
17 |
| Others |
119 |
126 |
134 |
139 |
144 |
145 |
| World Total |
2,017 |
2,059 |
2,132 |
2,162 |
2,122 |
1,995 |
The Number of Pigs People Kill Worldwide
Table 2. Number of Pigs People Kill Worldwide.
Top ten countries & Worldwide for years 2003 to 2008.
Figures are in millions.
|
| |
2003 |
2004 |
2005 |
2006 |
2007 |
2008 |
| China |
598 |
637 |
685 |
680 |
630 |
649 |
| European Union - 27 |
262 |
256 |
257 |
259 |
260 |
259 |
| United States |
102 |
103 |
104 |
106 |
108 |
110 |
| Russian Federation |
35 |
35 |
36 |
37 |
39 |
42 |
| Brazil |
30 |
30 |
32 |
33 |
36 |
36 |
| Canada |
31 |
33 |
33 |
32 |
32 |
31 |
| Japan |
17 |
17 |
17 |
17 |
17 |
17 |
| Mexico |
15 |
15 |
16 |
16 |
16 |
16 |
| Korea Republic |
16 |
15 |
14 |
14 |
15 |
15 |
| Ukraine |
7 |
6 |
7 |
8 |
8 |
8 |
| Others |
72 |
77 |
84 |
87 |
90 |
90 |
| World Total |
1,185 |
1,225 |
1,285 |
1,288 |
1,250 |
1,192 |
Notes
Notes for Tables 1 & 2
The source for the figures in Table 1 and Table 2 is Live Swine Selected Countries Summary. Production (Pig Crop) , and Total Beginning Stocks. In Livestock and Poultry: World Markets and Trade. United States Department of Agriculture, Foreign Agricultural Service, Office of Global Analysis. Circular Series DL&P 2-07 November 2007. www.fas.usda.gov. (Web site accessed February 2008.)
The United States Department of Agriculture (USDA) state that their data are based on "USDA-FAS attach� reports, official statistics, and results of office research" and that figures for 2007 are preliminary and are estimates for 2008. They also say their data include only those countries which are the major animal producers; therefore, World Total in this table is a minimum figure, less than the actual total.
The USDA provide two sets of figures in their original data: 'Total Beginning Stocks' and 'Production Crop' . Beginning Stocks are the animals alive at the start of the year and breed the Production Crop. The number of Beginning Stocks remain roughly constant from year to year and it is largely the Production Crop that is slaughtered. Pig numbers in this table include both classes of pig and should give an estimate of the total number of pigs in countries.
Livestock are impossible to count accurately; therefore I have rounded the figures in this table to avoid spurious accuracy and totals may not necessarily add up exactly.
Other Statistical Sources
- Food and Agriculture Organisation of the United Nations (FAO)
- Agriculture and Food � Livestock: Swine stocks. Earth Trends, World Resources Institute. www.wri.org. (Web site accessed January 2007.) Earth Trends obtain their data from the Food and Agriculture Organisation of the United Nations (FAO), FAOSTAT on-line statistical service (FAO: Rome, 2005).
The FAO figures are from 'spot counts'. A spot count is a census of animals on one day in the year (eg 1 July or 31 December). A spot count does not count all the animals born during the year (animals may have died before the spot count or born after it and not counted). Therefore FAO figures consistently underestimate the total number of animals.
- China Statistical Yearbook 2006
- 13-20 Number of Livestock. China Statistical Yearbook 2006. National Bureau of Statistics of China. www.stats.gov.cn. (Web site accessed March 2008.)
The USDA data above on pig numbers and slaughter agree reasonably will with data about pigs in China, differing by plus or minus a few million pigs for each year data is given.
|
|
|
|