|
|
|
|
Chapter 6 Cattle & Beef Statistics
 Summary
 Beef Cattle People Keep
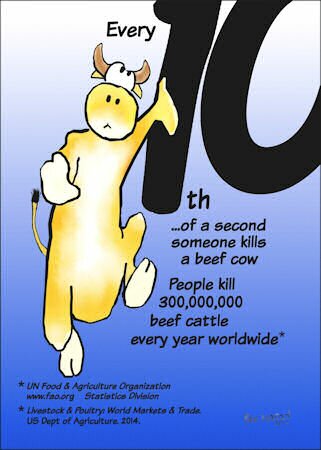
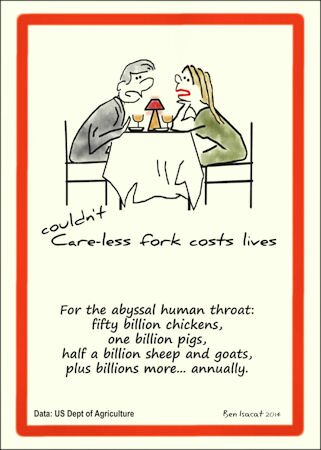
Beef Cattle People Kill
Notes for the Tables The source for Table 1 and Table 2 is based on 'Live Cattle Selected Countries Summary'. 'Total Cattle Beginning Stocks' plus 'Production (Calf Crop)' In Livestock and Poultry: World Markets and Trade. United States Department of Agriculture.www.fas.usda.gov (accessed July 2012). USDA state that their data are based on �USDA-FAS attache reports, official statistics, and results of office research.� USDA say the cattle are adults and calves raised for meat and exclude dairy cattle but include buffalo in India. Their figures for 2012 are a projection. USDA data included two classes of cattle: �Total Beginning Stocks� and �Production Crop�. Total Beginning Stocks are the animals alive at the start of the year and most of these animals are used to breed the Production Crop for the year. Virtually all the Production Stock is killed for food (some would replace Beginning Stock and some Beginning Stock would be killed). The figures in Table 1 include both categories. Cattle numbers in Table 2 are only the �Production Crop�. The World Total in both tables is a minimum figure. One reason for this is that the original USDA data do not include every country, although they do include the world�s major animal producing countries. Furthermore, the USDA figures are based on cattle who are officially counted (for example, at farms and slaughterhouses); cattle slaughtered outside official premises may not be counted. For example, non-walking cattle (that is �non-ambulatory� cattle, too injured to walk) may be killed before they get to the slaughterhouse and are not counted. In the US alone, non-walking cattle totalled 465,000 in 2003, including 185,000 calves, and 450,000 in 2004, including 180,000 calves (�calves� in this case are cattle under 230 kg / 500 lbs). Livestock are impossible to count accurately. Therefore the figures in both these tables are rounded to avoid spurious accuracy and totals do not necessarily add up exactly.
›› To Entries & Home |
Free Illustrations
|
||||||||||||||||||||||||||||||||||||||||||||||||||||||||||||||||||||||||||||||||||||||||||||||||||||||||||||||||||||||||||||||||||||||||||||||||||||||||||||||||||||||||||||||||||||||||||||||